What a 30-day sample shows about Pokemon reference-price changes
Between and , the median of 150 sampled product records moved +1.7%.
How to read that figure. It is a median of medians: for each product record we take the middle value of its condition and printing variants, then the middle value across all 150 products. It is not total market growth, not an average portfolio return, and not a forecast.
Example cards included in the sample
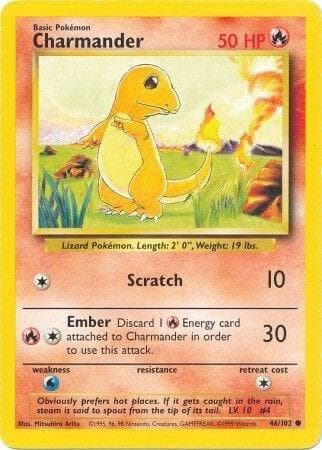
Charmander
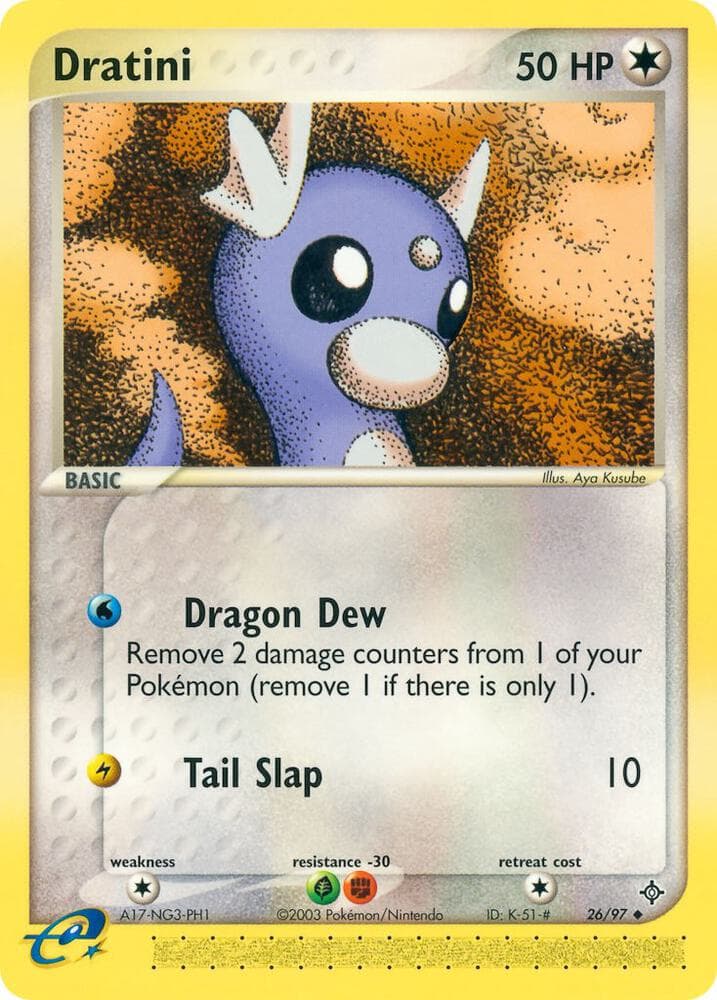
Dratini
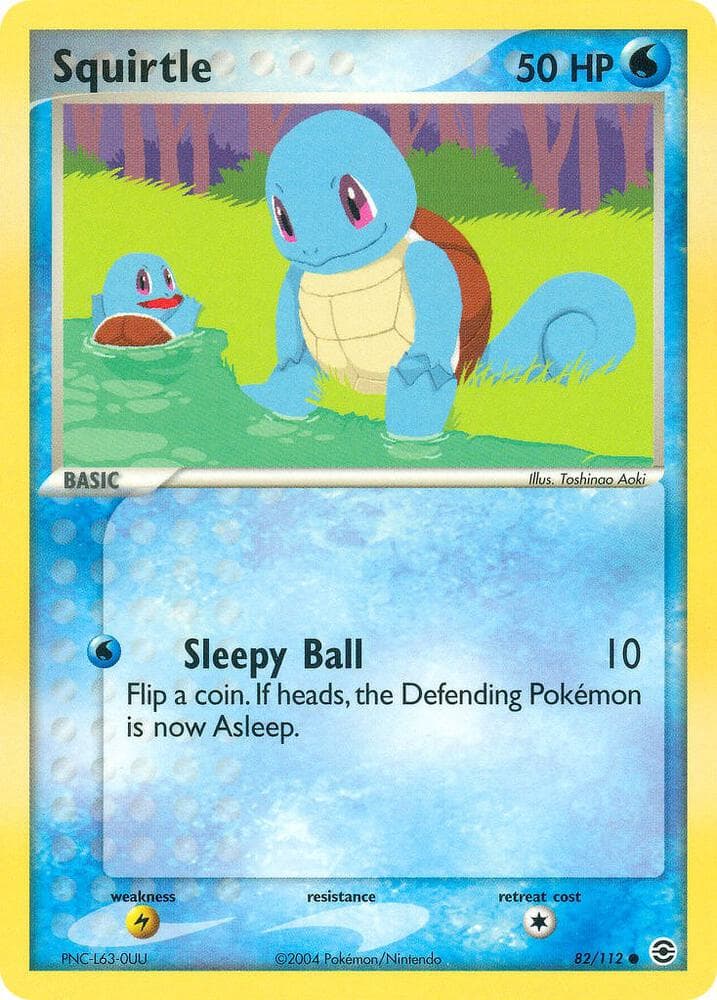
Squirtle
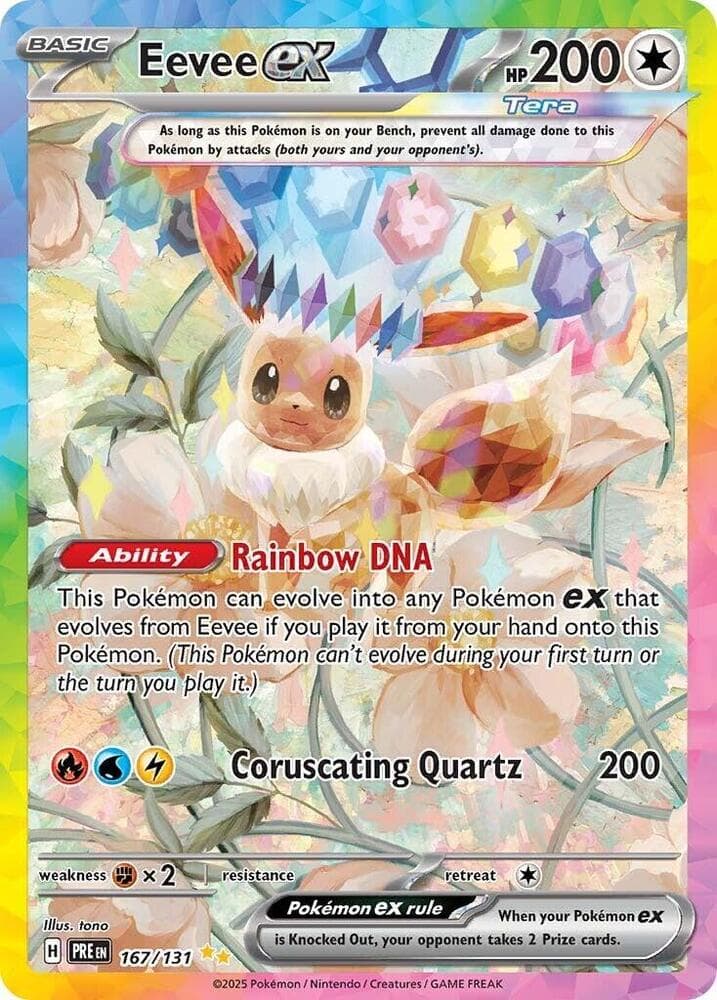
Eevee ex
Four cards that were included in the sample, shown as examples of what was measured — not its biggest movers. Catalogue artwork identifies the card; it does not illustrate Near Mint, Played or Damaged condition.
How the 150 product records moved
- Up >1%
- 59.3%
- Flat ±1%
- 36%
- Down >1%
- 4.7%
Product summaries conceal what individual variants did
Every product is sold in several variants — each condition (Near Mint through Damaged) in each printing (Normal, Reverse Holofoil, 1st Edition and so on) carries its own price and its own history. Our 150 product records hold 1,147 measurable variants. The medians sit close together; the declining share does not.
Up more than 1%
Flat within 1%
Down more than 1%
| View | Median | Up >1% | Flat ±1% | Down >1% |
|---|---|---|---|---|
| By product record (150) | +1.7% | 59.3% | 36% | 4.7% |
| By individual variant (1,147) | +1.4% | 51.3% | 26.7% | 22.1% |
4.7% of product medians fell, against 22.1% of individual variants. The variant-level view preserves differences that product summaries conceal. To assess a particular copy, check its exact condition-and-printing reference. Both percentages are sample statistics, not a valuation of any individual card.
A worked example: Cubone (Jungle)
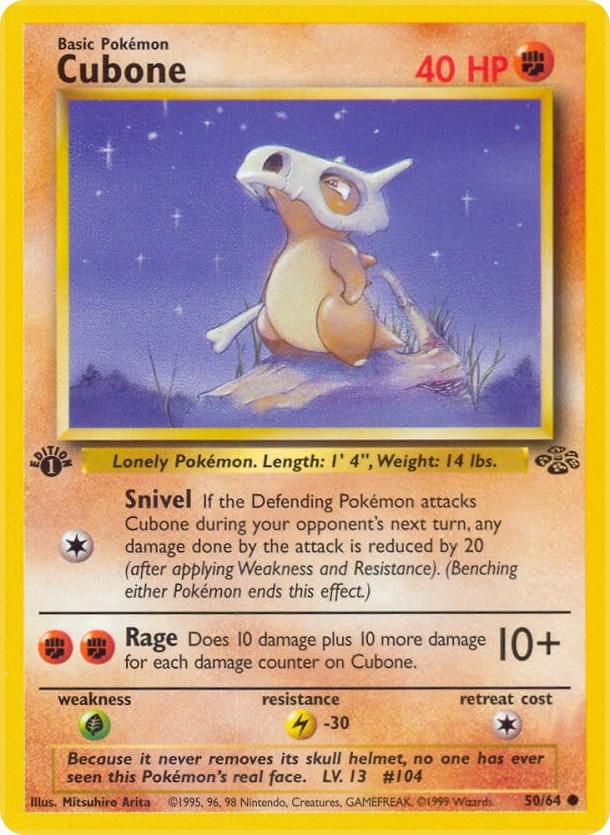
Cubone finished the window with a product median of +1.7% — while 5 of its 10 variants fell.
| Printing / condition | 12 Aug (USD) | 11 Sep (USD) | Change |
|---|---|---|---|
| Unlimited / Near Mint | $2.23 | $1.98 | -11.2% |
| Unlimited / Lightly Played | $0.72 | $0.80 | +11.1% |
| Unlimited / Moderately Played | $0.64 | $0.57 | -10.9% |
| Unlimited / Heavily Played | $0.41 | $0.39 | -4.9% |
| Unlimited / Damaged | $0.25 | $0.31 | +24% |
| 1st Edition / Near Mint | $10.28 | $11.13 | +8.3% |
| 1st Edition / Lightly Played | $4.79 | $5.31 | +10.9% |
| 1st Edition / Moderately Played | $2.08 | $2.66 | +27.9% |
| 1st Edition / Heavily Played | $3.40 | $3.02 | -11.2% |
| 1st Edition / Damaged | $2.57 | $2.21 | -14% |
The single figure “+1.7% for Cubone” is a product-level summary. It is not the movement of any one row above: a 1st Edition Near Mint reference rose +8.3% while an Unlimited Near Mint reference fell -11.2% over identical dates.
By era group
| Group | Products | Median | Up | Flat | Down |
|---|---|---|---|---|---|
| Modern (SWSH / SV / ME) | 50 | +0.9% | 50% | 44% | 6% |
| EX-era | 50 | +2.1% | 68% | 32% | 0% |
| WOTC-era | 50 | +1.7% | 60% | 32% | 8% |
Each group holds exactly 50 product records because we allocated them equally on purpose. The groups are not sized to reflect how many cards exist in each era, so the overall figure describes this sample, not the hobby.
How this was measured
Source
Market data provided by JustTCG. These are reference-price observations — a provider estimate of a variant's market price — not records of individual completed sales. The provider documents its current price field in US dollars. It states no currency for historical points and returns no currency field, so the currency of the historical values is an inference on our part, not an explicit field in the response.
Sampling
24 deliberately selected pilot records were retained from earlier feasibility work, then 126 further records were selected by seeded deterministic shuffle — 42 per group — giving 150 in total. The pilot records were not randomly chosen, so the sample as a whole is not a random sample. Selection ran against our own catalogue before any provider lookup, so a record returning no data would have been kept as non-response rather than quietly replaced; none did. Seed 20260912.
What the sample contains
- Modern (SWSH / SV / ME) — 50 sampled product records drawn from 28 sets, including 6 promo products and 2 gallery-subset products.
- EX-era — 50 sampled product records drawn from 16 sets matching our EX-prefix rule (not every set matching that rule was sampled).
- WOTC-era — 50 sampled product records drawn from 11 sets.
Promos and gallery subsets were not excluded. Eras outside these three patterns are absent entirely: e-Card (Expedition, Aquapolis, Skyridge), Diamond & Pearl, Platinum, HeartGold SoulSilver, Black & White, XY, Sun & Moon, Legendary Collection, and Japanese-language cards.
Dates
and are target dates. For each variant we used its observation nearest each target, required within ±3 days, with no interpolation and no carrying a previous day's value forward. In practice every eligible variant matched 12 August 2026 exactly at the early endpoint. At the late endpoint, 1,145 matched 11 September 2026 and 1 used and 1 used .
Coverage
1,290 variant records were returned across 150 product records; 1,147 were eligible and 143 were excluded — 115 with no price history at all, 26 without an observation close enough to a target date, and 2 with only a single observation. Every product record contributed at least one eligible variant.
Identity
We ran one check: does the same provider set, collector number, printing and condition resolve to more than one record? It found 0 conflicts. That is a result about the check we implemented — it is not evidence that every physical printing is uniquely identified in this data. 15 variant records reuse a printing label across two different set records (for example Alakazam “1st Edition Holofoil” under both Base Set and Base Set Shadowless). We kept both records in each case. We are not asserting these are duplicates, and we are not asserting they are independently verified products; the data we hold does not settle it.
Robustness
Excluding the 37 variants containing a single day-over-day move of 50% or more leaves the median at +1.7%. Excluding the 24 retained pilot records gives +1.8% across 126 records; those 24 alone give +1.4%. The overall median changed little in these two sensitivity checks.
What this does not tell you
- Reference estimates, not sales. No completed transaction is evidenced here.
- An unchanged number is not proof of an inactive market. We cannot tell a fresh estimate that landed on the same value from a figure carried forward — the data does not label which is which.
- This is not the Pokemon market. It is 150 product records across three equally-allocated era groups, with several eras absent.
- A product median does not describe an individual card. As Cubone shows, variants inside one product moved in opposite directions over identical dates.
- One 30-day window. It is not a trend, and nothing here indicates what any price will do next.
- No investment guidance. Nothing here is a recommendation to buy, sell or hold.
- Single source. These figures are not merged with any other price provider.
Citing this study
This is a fixed, dated snapshot — the figures describe the window above and are not refreshed. Please identify them as Pokemon Deal Finder's analysis of 150 sampled product records and include both dates.
Pokemon Deal Finder, "Pokemon Reference-Price Changes: A 30-Day Sample", 12 August 2026 to 11 September 2026. https://pokemondealfinder.com/market-data/pokemon-reference-price-changes
Study version 2026-09-12.1. Full site methodology: methodology.